Our own build · Red Bridge tool
A throwaway site and a drop-in debugger for testing third-party widgets
Before a third-party conversational widget goes live on a client site, we want to know how it behaves as a real visitor moves through the pages. Does it stay put. Does it hold one session. What does it write to the browser. So we stood up a small staging site of our own, and a debugger you drop onto any page to watch the answers in real time.
Why we built it
You don't debug a widget on the live site
Vendor embeds, chat, conversational marketing, consent tools, all get pasted onto a page and then behave however they behave. The interesting questions only show up once you navigate. Does the widget re-load on every page or stay alive across the visit. Is the same session following the visitor from page to page. What cookies is it setting, and where.
Testing that on a production site is slow and risky, and the browser's own tools are scattered across three panels. We wanted one clean surface that answers those questions on a site we fully control and can throw away when we're done.
What we stood up
Six pages, one snippet, a real site to walk through
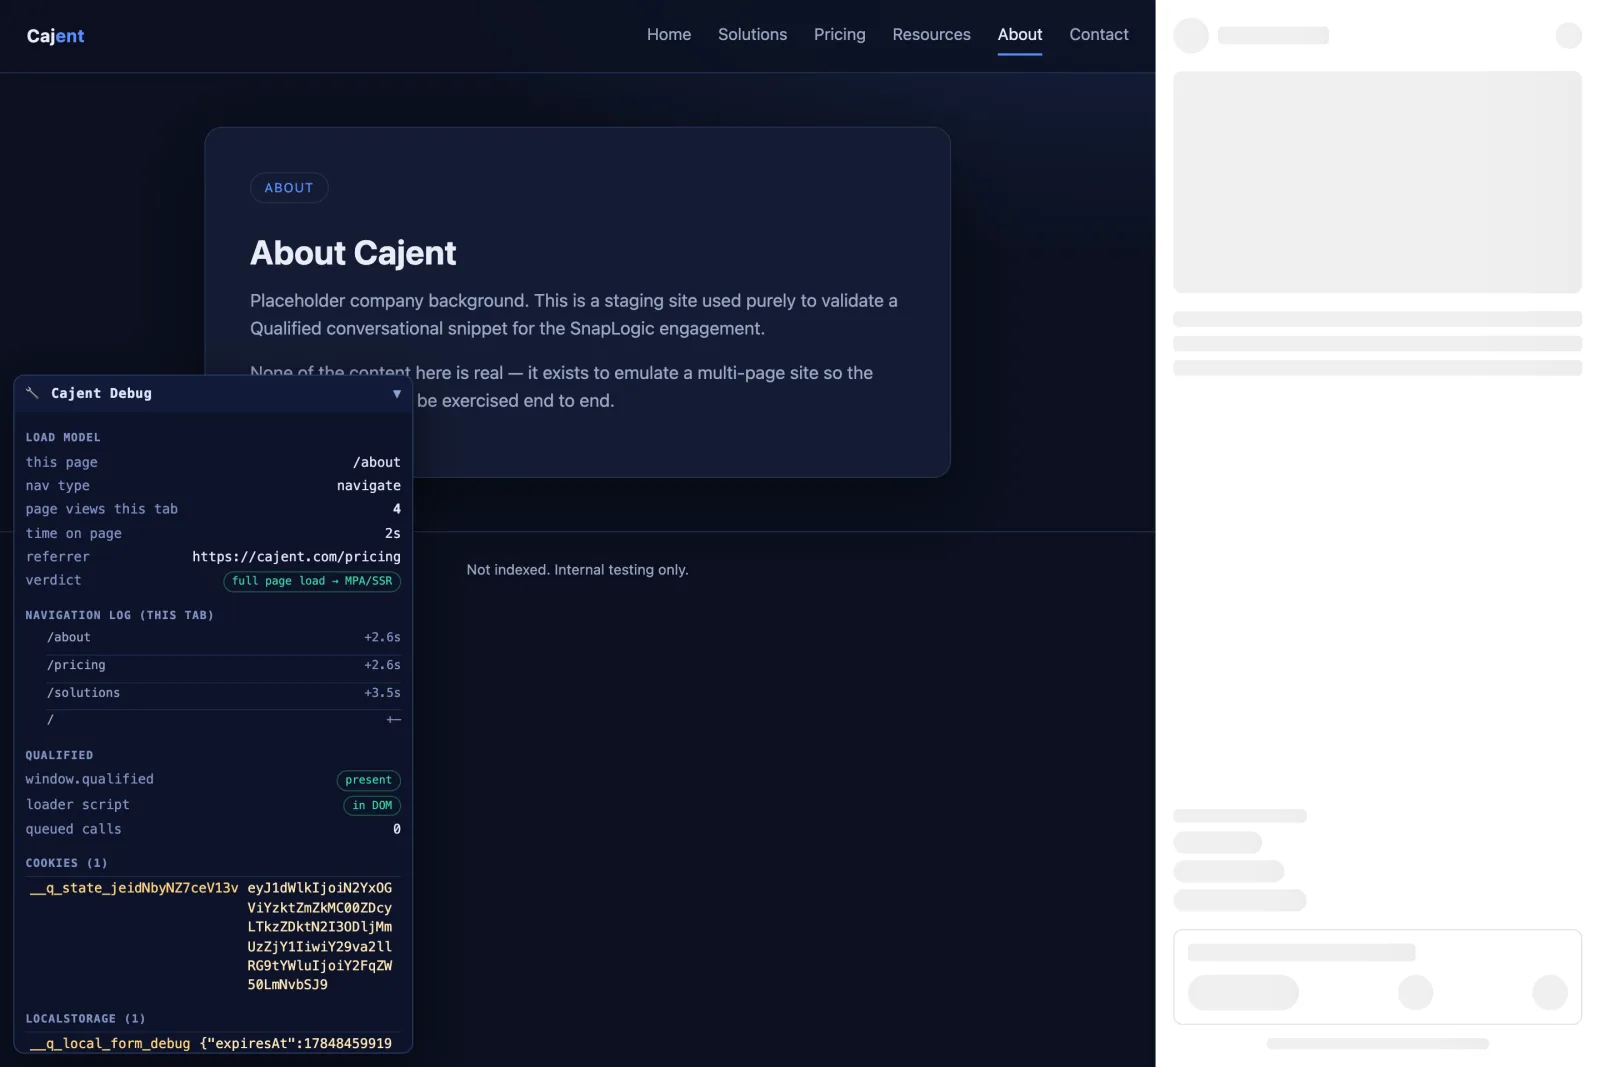
A small static site on Cloudflare Pages: a home page plus five placeholders, a shared nav, and the vendor snippet on every page. Git-connected, so a push rebuilds it in under a minute. It uses clean URLs and full page loads, so navigating it looks to the browser exactly like a standard WordPress site, which is what we're emulating.
The useful part
A debugger that rides along on every page
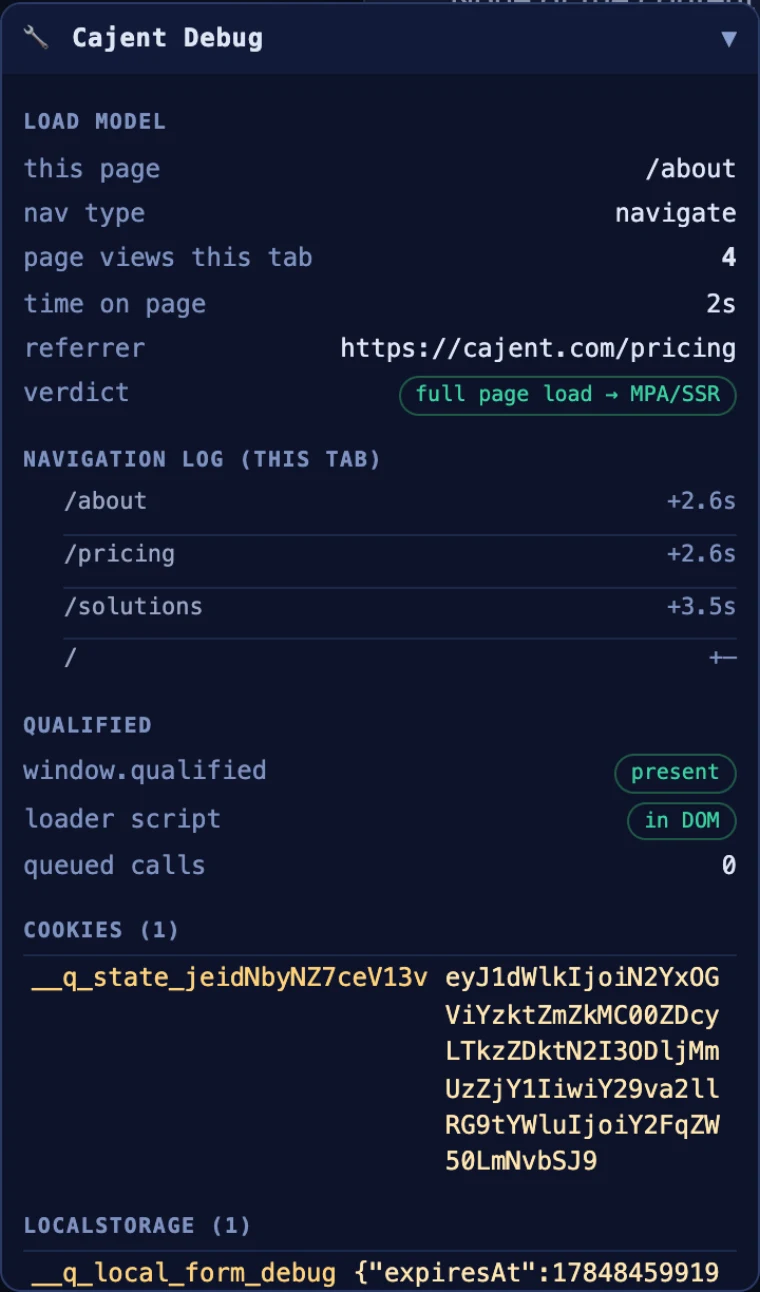
The debugger is one small script. Drop the tag on a page and it paints a panel in the corner, then refreshes itself every second, because a widget tends to write its cookies a beat after the page loads. Four things we actually wanted to see, in one place.
Load model
Full page load or single-page app, the nav type, and a per-tab page-view count that climbs on every real navigation.
Navigation log
The ordered list of pages visited this tab, with the time between each. The visit, as a journey.
Widget status
Whether the loader object is present, whether its script is in the DOM, and how many calls are queued.
Cookies & storage
A live dump of first-party cookies and localStorage, with the widget's own keys highlighted.
The first question it answers
Full page load, or single-page app?
This is the one that trips people up. On a classic multi-page site, every click is a full page load: the browser throws away the old page and re-runs every script, so the widget re-initializes each time. On a single-page app, the page never reloads, so the widget's script runs once for the whole visit. Those are very different lifecycles, and a widget can behave well in one and badly in the other.
The panel settles it. The page-view counter lives in the tab's session, so it climbs by one on every genuine reload and the verdict flips to full page load. On a single-page app it would stay stuck at one. A standard WordPress site loads the way this staging site does, so if the real site ever reads as a single-page app, that's the flag to chase down: a caching or instant-page plugin, or a headless front end, changing the widget's lifecycle out from under you.
Watching the cookies
One session, following the visitor
Cookies are where a conversational widget keeps its identity, so this is the part we lean on most. Walk from page to page and watch the widget's session cookie: the value should stay the same, which is how it keeps one conversation alive across a full-reload site. If that identifier changes on each page, the widget is starting over every time, and that's a real problem to catch before launch.
Why it sticks around
Vendor-agnostic, and gone when you want it gone
Nothing in the debugger is tied to one vendor. It reads the page, the cookies, and the storage, and highlights whatever keys match. So the same panel works for the next chat tool, consent manager, or analytics tag we need to sanity-check. Add one script tag to turn it on, delete the tag to turn it off.
<!-- turn the debugger on -->
<script src="debug.js"></script>

# the staging site itself: static files, no build step
git push        # Cloudflare Pages rebuilds in under a minute
The stack
- Static HTML
- Cloudflare Pages
- GitHub
- Vanilla JS, no dependencies
- One drop-in script
We build and run sites for funded technology companies
Small tools like this come out of that work. When a third-party embed has to behave, we'd rather see it than guess.